
STI was very near to its upper resistance zone of 3,320 on Thurs 28 Mar 13. However, it was a red candle and indicators did not give any conclusion as the index has been moving sideway for the past few weeks. We will need to wait for price action to confirm a breakout of resitance or continuation of consolidation within a tight zone. Although the bearish divergence has been there for weeks, ultimately it is price action the rules.
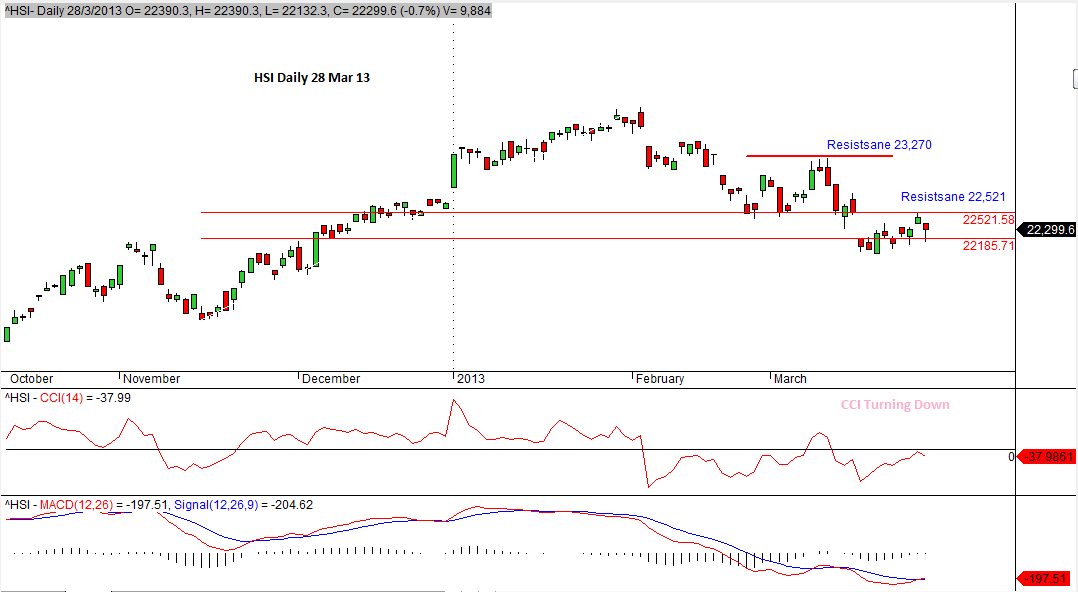
HSI performs rather badly and seems to continue falling for the coming week with indicators hinting continuation of downtrend momentum. Its support is currently at 22,185. We need candles to close below this level to confirm a breakdown.
