Market Comments (STI) for the Week of 3 Aug 15

STI has broken the strong support with a big gap down and high volume, closing at 3,202 on Friday 31 July 15. The sell down was really fast and furious although on that day, Hang Seng and Shen Zhen composite Index were fairly stable. It was revealed that the hugh sell down was led by Noble, which was given a warning by SGX. Looking at the volume and magnitude of the sell down, I would expect the down trend to continue for quite a while more and in view of the coming National Day week, it will be worsen when approaching the public holidays.

The next 2 support zones are in the regions of 3,160 – 3,130 and 3,060 – 3,030. We shall see how STI reacts near these regions before making any trading decisions. If you have taken profit / cut losses, do stay in the side line.

Market Comments (STI) – 30 July 15

STI has been suffering from macro economics factors. It has been in RED for the past straight 7 trading days. There is a strong support is at 3,230. I would expect there will be some reaction around that region and we shall see if the Index gets supported or the free fall continues. At the moment, the Index is having a down trend.

Market Comments (STI) For Week of 7 Oct 14

The support is simply fantastic. Do not short, when it is near support. For intraday trading, look for hourly signal to long when near support. Current candlestick pattern shows indecision. Traders can choose to stay on the sideline until clear signal appears. Wait for a few candles to appear as candles are still stuck along diagonal neckline (not drawn).

Last week’s comments for reference – (Written on 1 Oct 14)

“STI Index is currently making a long awaited downtrend. Support 1 is at 3,250 followed by Support 2 at 3,220. Candlestick pattern reveals the weakness of the Index and the turning down of MACD supports further downside. Traders to observe RSI break and market reaction at the 2 Support levels to detect reversal.

If the break of neckline (not drawn) of the double top formation is realised, then we are looking at medium term downtrend and reversal will not be so soon.”

完节

Market Comments (STI) For Week of 1 Oct 14

STI Index is currently making a long awaited downtrend. Support 1 is at 3,250 followed by Support 2 at 3,220. Candlestick pattern reveals the weakness of the Index and the turning down of MACD supports further downside. Traders to observe RSI break and market reaction at the 2 Support levels to detect reversal.

If the break of neckline (not drawn) of the double top formation is realised, then we are looking at medium term downtrend and reversal will not be so soon.

Market Comments (STI) For Week of 19 May 14

The STI has been resisted at the level of 3,260 for several times and the resistance continues to be a fairly strong one. Technically, STI is currently trading a rectangle pattern for the past 4 weeks with the top at 3,285 and bottom at 3,220. I would expect this this tight trading range to be broken soon. However, it is still hard to say whether it will break above 3,285 or remains in the trading range for a while longer.

As you can see, the signals from MACD and RSI are conflicting as the index is currently not in trend. Hence, it is always recommended to look at real market actions instead of indicators.

Given the imminent release of corporate results, it seems that there are more potential upsides for Index.

Market Comments (STI) Update 29 Apr 2014

photopin-flyer
STI Daily 29 Apr 14

The STI index made a false breakup above 3,260 for several days and came back to below the resistance of 3,260. The candlestick pattern for those candles above 3,260 is not sustainable and their bullish nature was short lived. This was anticipated in the last posting 2 weeks ago.

As at 29 Apr 2014, the STI closed at 3,237 with RSI making a failure swing and MSCD crossing down below the signal line. The next support is at 3,200. Let’s see how the index react at 3,200. When it gets supported and the indicators are wearing off, signifying supported retracement, look for a high probability setup for entry.

photo credit: Eustaquio Santimano via photopin cc

Market Comments (STI) for week of 17 Mar 14

hkse

STI Daily 14 Mar 14

In my earlier posting on 9 Mar 14, I had mentioned that a false breakout was likely to happen and we needed to observe for 1 to 2 more trading days to confirm this. Indeed, the candlestick appearance didn’t look good on 10 & 11 Mar 14 (after my posting) and the Index fell strongly to close at 3,097 on 12 Mar 13. The drop continued and as at 14 Mar 13, the STI has reached the immediate support of 3,065 (Low of 3,060 and Close of 3,073) on 14 Mar 14. I have asked traders to take profit as early as 28 Feb 14 and reminded again on 9 Mar 14.

With the accurate forecast, I hope you have exited with some profit.

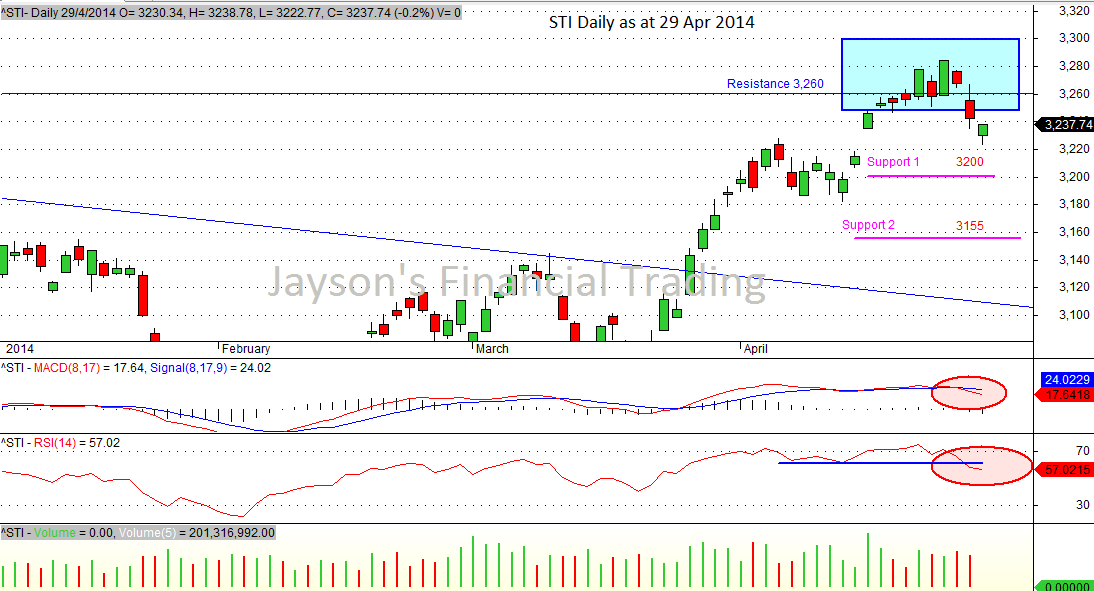
For the coming week, I would expect STI to be weak and consolidate between 3,065 to 3,120. For indicators, they have confirmed a retracement with MACD crossing signal, RSI failure break and volume dropping. If the current support at 3,065 failed, the next support is at 3,030.

photo credit: Baron Visuals via photopin cc