STI 26 Feb 13 (Daily)

STI_26 Feb13 Daily

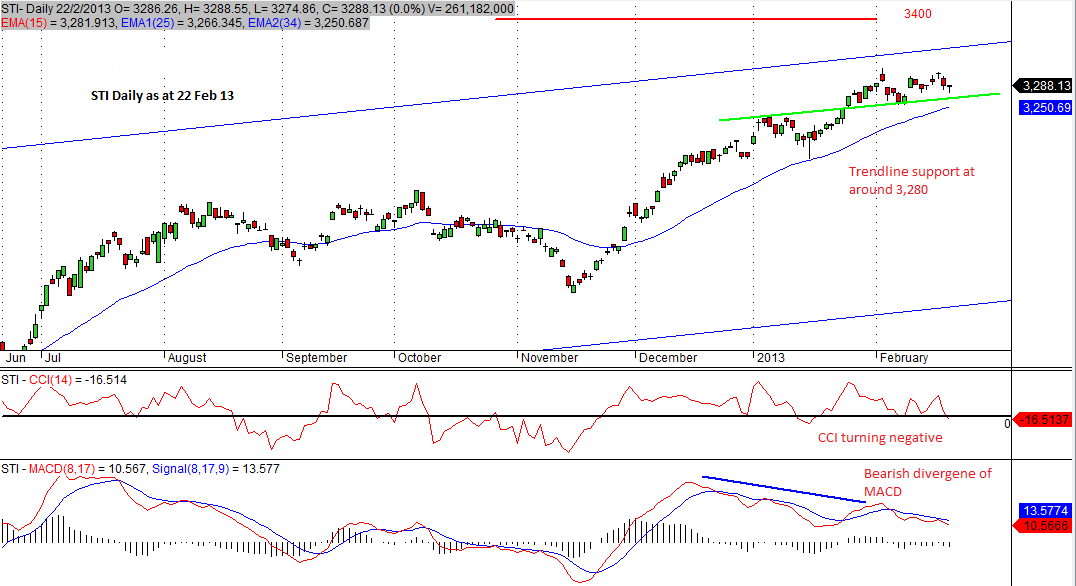
Sometimes I wonder how come bad news coincide with technical reversal. Today STI actually gap down and broke its short term support. I am looking at next support at 3,160-3,170. For those who haven’t seen my earlier posting, please take a look at the posting of STI 22 Feb 13 (weekly/ daily) on my analysis of STI in near term. Let’s wait to see if STI gets supported at 3,160 – 3,170. I would also expect evening star candlestick pattern to form at the end of the week in the weekly chart.

Chip Eng Seng 22 Feb 13

Chip Eng Seng Feb13 Daily

The daily chart of Chip Eng Seng shows that the counter is currently being supported. However, it is still away from a stronger support of $0.77. Indicators show that price is likely to continue its retracement. With STI also reaching its resistance, buying this counter now is definately not a low risk entry.

STI 22 Feb 13 (Daily / Weekly)

STI_22 Feb13 Weekly

STI_22 Feb13 Daily

The week ended with STI further consolidate and close at 3,288 on 22 Feb 12. Though still bullish, the index is losing momemtum as it approaches the resistance at channel ceiling and the weekly resstance of 3,319. Daily indicators also showing momentum slowing down with CCI turning negative and appearance of MACD bearish divergence. Weekly chart DOji appeared, signally the possibility of a reversal. Investors should watch out for profit-taking soon.

STI 15 Feb 13 (weekly chart)

STI_15Feb13

Bullish STI has climbed up far but there was not much movement on 14 and 15 Feb 13. Taking a look at the weekly chart,  it is reaching the upper channel line (blue) and there are some resistances (red line) present. Immediately resistance is 3,317 and next will be 3,356.These are strong resistances and I would expect STI to have some reaction/ profit-taking at these levels. If STI is able to break free of this channel, then we are looking at 3,400.

3,530 level, derived from the weekly chart and is definately the strongest resistance in the near term. I don’t foresee it reaching so soon without and retracement. Watch out for reversal signals at these levels.

Immediately support is around 3,160. Always remember, enter at support and exit at resistance.

24/7 Wall St.

TradersMarket rumors and speculation has been about that other exchanges would either go private or would merger together after this mega-exchange merger between NYSE Euronext, Inc. (NYSE: NYX) and IntercontinentalExchange, Inc. (NYSE: ICE). The first of the formal rumors in this exchange M&A is now Nasdaq OMX Group Inc. (NASDAQ: NDAQ).

The Wall Street Journal has discussed that private equity player The Carlyle Group LP (NASDAQ: CG) has held discussions with NASDAQ OMX about possibly going private. The talk is that the private equity group approached the electronic trading exchange but it is also said that talks are not ongoing as the two companies did not see eye to eye on price. The tie here is that NASDAQ’s former CFO is now the Carlyle CFO.

We have said that exchange mergers are likely to consider as long investors understand that regulatory risks are…

View original post 118 more words