
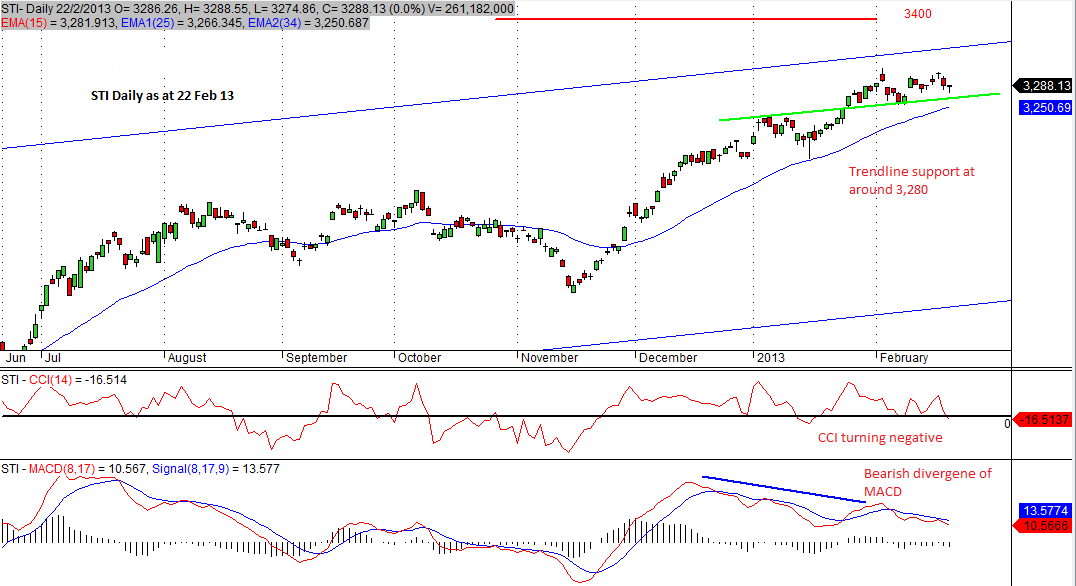
The week ended with STI further consolidate and close at 3,288 on 22 Feb 12. Though still bullish, the index is losing momemtum as it approaches the resistance at channel ceiling and the weekly resstance of 3,319. Daily indicators also showing momentum slowing down with CCI turning negative and appearance of MACD bearish divergence. Weekly chart DOji appeared, signally the possibility of a reversal. Investors should watch out for profit-taking soon.
