Market Comments (STI) for 28 Feb 14

STI Daily 27 Feb 14

After a beautiful recovery starting from 4 Feb 14, the STI is currently at resistance of 3,100 – 3,120. I would expect the Index to take a breath and consolidate for a while before testing 3,120 again. Looking at Dow Jones peaking and HSI also begins its consolidation, it will be sometime before the Indexes gain their strength to climb higher grounds.

Traders may take some profit now.

Market Comments (DJI / HSI / STI) For Week of 15 Apr 2013

STI 12 Apr 13

HSI 12 Apr 13

DJI 12 Apr 13

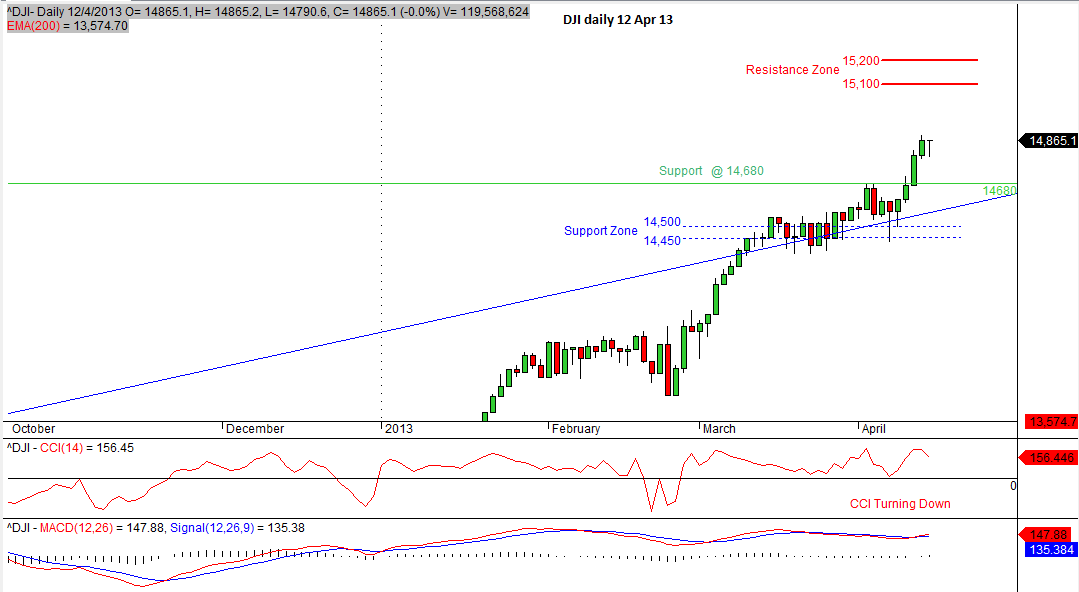
The Dow Jones has broken its resistance of 14,860 on Wed, turning this level from resistance to support. If the strength continues, we are likely to see the index hiting its next resistance of 15,100 to 15,200. Trader wanting to enter can wait for slight pull back towards 14,860 and enter long. There are probably some consolidation in the coming week before DJI making its way towards the 15,000 mark.

HSI – The Hang Seng Index was being rejected nicely by the resistance level of 22,185. The index is in a short to medium term downtrend. If you plot in the moving average, it is below 100 days moving averages but supported my the 200 days moving averages. Both the CCI and MACD are negative. The down momentum is likely to continue and we are looking at next support zone at around 21,080 to 21,280.

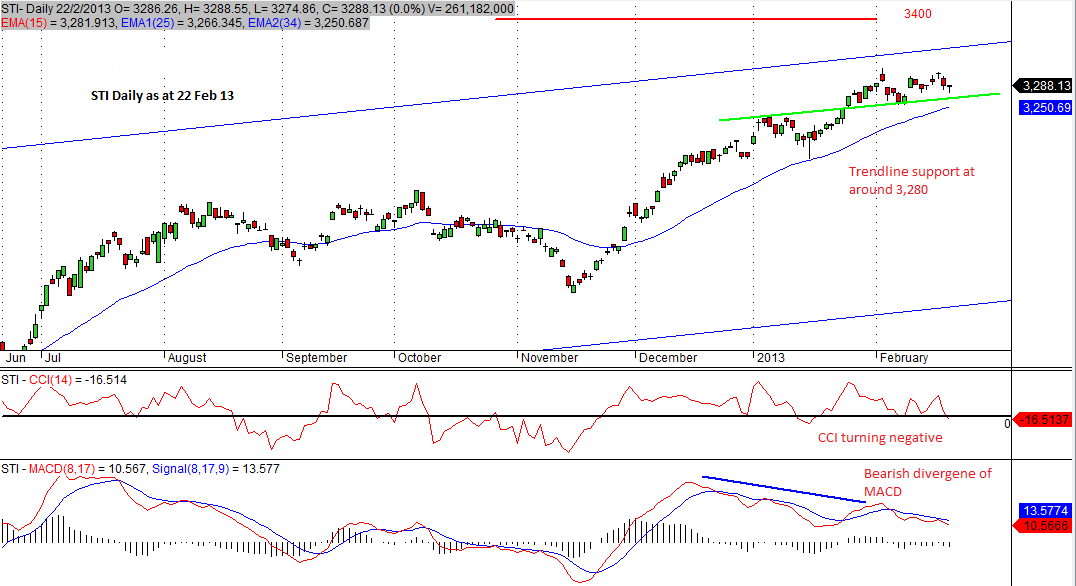
STI – The Straits Times Index has been trapped in the rectangle (sideway) for the last 2 months. CCI is negative again and MACD has crossed its signal line. We shall expect STI t0 continue its sideway movement until it breaks its upper channel resistance and previous high of 3,331 clearly.

STI 22 Feb 13 (Daily / Weekly)

STI_22 Feb13 Weekly

STI_22 Feb13 Daily

The week ended with STI further consolidate and close at 3,288 on 22 Feb 12. Though still bullish, the index is losing momemtum as it approaches the resistance at channel ceiling and the weekly resstance of 3,319. Daily indicators also showing momentum slowing down with CCI turning negative and appearance of MACD bearish divergence. Weekly chart DOji appeared, signally the possibility of a reversal. Investors should watch out for profit-taking soon.

STI 24 Dec 12

As mentioned earlier on (refer to my chart on 12 Dec 12), I would expect STI to have some reaction at my resistance zone. Please see the chart and look at how beautifully the bulls and bears struggle in the region of 3,160-3,168. Of course at some days, STI even went to 3,175. As at 12.30 pm, it hovers around the region of 3,163. As a trader, I will not enter here. I will either tighten my stops or take partial profits. I think price will still be holding until all the merry making is over. LOL !

Some readers asked me why my chart is so simple without indicators? All I can say is that almost all indicators are lagging and they are a derived from price. ThereĀ are specific uses for indicators, but not in this aspect.

STI_24Dec_12

STI 12 Dec 12

STI broke its 12-months high of 3,100 and attained a high of 3,145 today. Looking at the chart, the Index is reaching the upper channel resistance as well as projected resistant of 3,160. I would expect market to react around these resistances. Expect profit taking in this region then follow by a small pause before market searches for new direction again.

STI_12Dec12