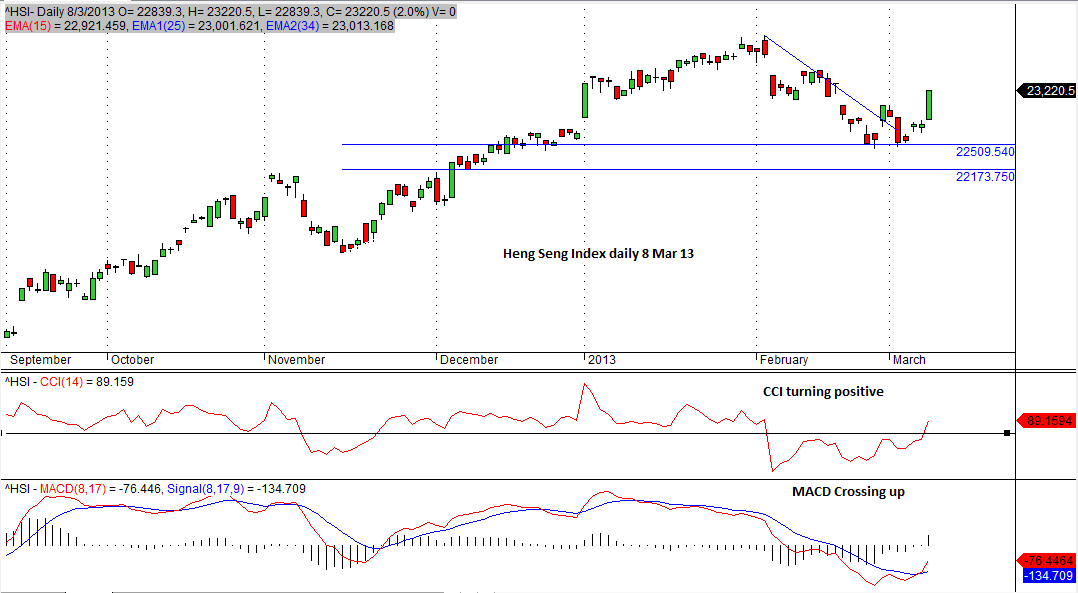
Hang Seng Index is reversing now. It is a low risk entry to enter HK stocks to ride on the reversal.
A Trader's Journal
Hang Seng Index is reversing now. It is a low risk entry to enter HK stocks to ride on the reversal.
 China’s exports jumped in February, which may indicate a recovery of the economy across most of the rest of the world. Or it could be that inventories of goods are low in many nations and have to be restocked.
China’s February exports, spurred by demands from the United States and other markets, rose 21.8 percent annually to $139.37 billion, a government agency said.
In a further demonstration of China’s strong recovery in its foreign trade, the General Administration of Customs said Friday imports fell 15.2 percent year-on-year to $124.12 billion, yielding a monthly trade surplus of $15.25 billion.
In February of last year, China had a trade deficit of $31.98 billion.
The agency said, however, the numbers would be different when making allowance for seasonally-adjusted factors such as four fewer working days in February due to the Spring Festival.
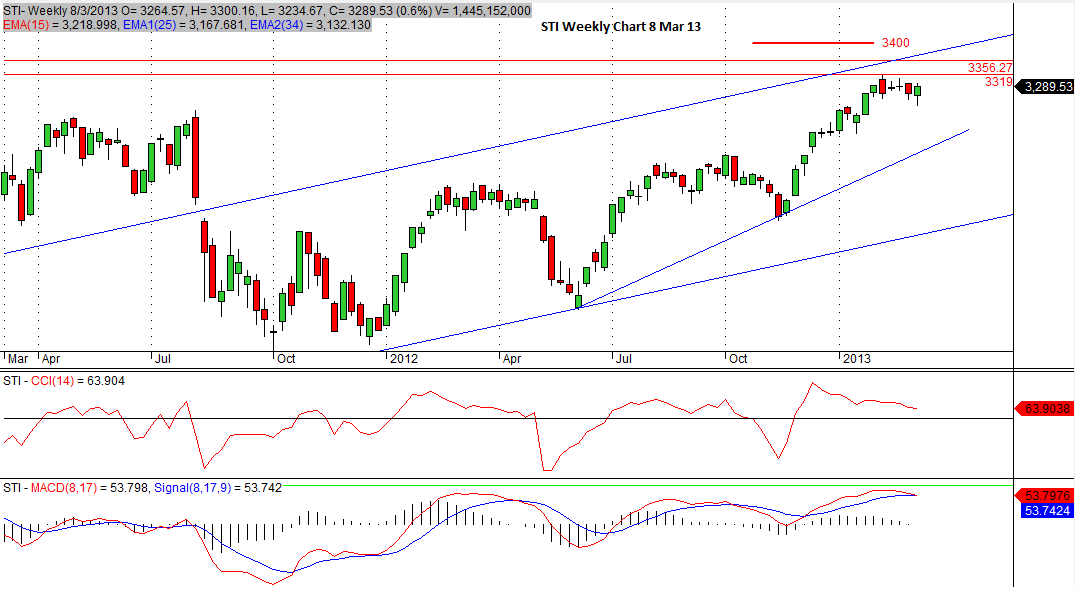

STI is still consolidating. Edging up with lesser strength. My earlier comments on STI is still unchanged. Due to high spirit in DJ, STI was lifted up on Wed and Thurs. However, it lacked strength on Friday 8 Mar and resulted in a red candle.

Due to good news of Dow Jones, Asia market was lifted for the past 1 day. It has somehow halted the retracement/ profit taking and invite a buying volume. I would say the price is still consolidating and will be bounded by its resistance at 3,320-3,340 (inside the bigger channel) and its support at 3,160-3,170. Investor has to be patient and see how the index develops before opening a trade. I will only enter either when it is at its support or when price break out from resistance (3,320 – 3,340 or upper channel line) with strong momentum. At the moment, some stock counters rebounded while some still displaying reversal patterns.
At the moment, it seems to me that the market is moving sideway with no clear signal.
 The Dow Jones Industrial Average has now hit a new high, and it did it on a day where there is actually very little news acting as the driving force. The prior closing high was 14,164.53 from October 2007. The intraday highest price was 14,198.10 at the time. Now on Tuesday you know what the deadlines will say in every print edition on Wednesday.
DJIA HITS NEW ALL-TIME HIGH!
The DJIA is up more than 75 points after the market open and is at 14,219 this morning. Our readers should not be surprised at all by the new high. We have been calling for unofficial upside to our 14,590 target we set as the peak DJIA price for 2013.
We have not yet issued a DJIA 15,000 alert nor have we formally lifted our price target to that level. The key word is “yet,” but we are in no real…
View original post 107 more words

Technically, this counter is showing reversal signal with head and shoulder pattern. Price break below neckline.

STI continues to consolidate with a long bearish candle on 4 Mar 13. It is clearly its previous support turn resistance line.


Evening Star showed up in the weekly chart of 1 Mar 13 as predicted on 26 Feb 12. STI daily chart showing sideway consolidation. My comments of 22 Feb 13 is still relevant. It seems that the index is trying hard not to sink to its support of 3,160 – 3,170. Trader have to wait patiently for buying opportunities.
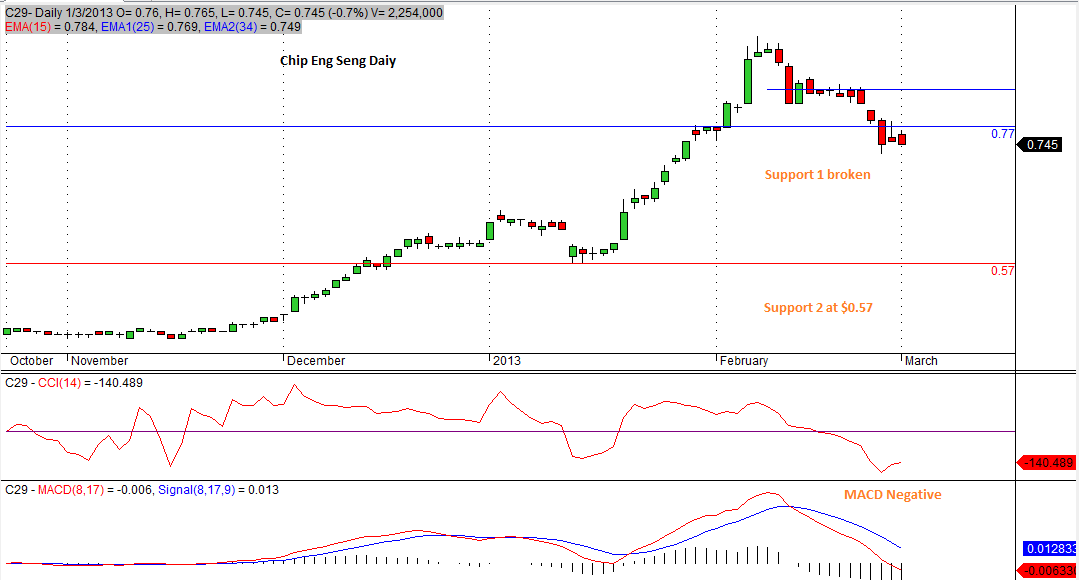
Support 1 reached. Pls refer to earlier posting of 22 Feb 13 of Chip Eng Seng Daily which highlight my comments which are spot on.

Sometimes I wonder how come bad news coincide with technical reversal. Today STI actually gap down and broke its short term support. I am looking at next support at 3,160-3,170. For those who haven’t seen my earlier posting, please take a look at the posting of STI 22 Feb 13 (weekly/ daily) on my analysis of STI in near term. Let’s wait to see if STI gets supported at 3,160 – 3,170. I would also expect evening star candlestick pattern to form at the end of the week in the weekly chart.
