Kepland still experiencing consolidation with the new support of $4.01 and resistance of $4.2 as shown.

A Trader's Journal
Kepland still experiencing consolidation with the new support of $4.01 and resistance of $4.2 as shown.
The Dow had a -158 on 28 Dec 12, Friday. It closed at 12,938 below the 13,000 pts which it has held above consistently for the past 1 month. DJ is still bullish at the moment while making retracement. Currently near to fibo 50% of the previous swing which is at 12,916. The index will likely to reverse at about this level or at the next lower support at 12,811.

The charts are self explanatory. Basically, Olam is supported and it likely to reverse trend. We shall need to observe a few more candles. As for Kepland, it has broken previous resistance but the candle wick don’t look good and has shown sign of an exhaustion.


As mentioned earlier on (refer to my chart on 12 Dec 12), I would expect STI to have some reaction at my resistance zone. Please see the chart and look at how beautifully the bulls and bears struggle in the region of 3,160-3,168. Of course at some days, STI even went to 3,175. As at 12.30 pm, it hovers around the region of 3,163. As a trader, I will not enter here. I will either tighten my stops or take partial profits. I think price will still be holding until all the merry making is over. LOL !
Some readers asked me why my chart is so simple without indicators? All I can say is that almost all indicators are lagging and they are a derived from price. There are specific uses for indicators, but not in this aspect.

Kepland exhibited a marvelous rebound, upon hitting support of 3.27. It is now at its resistance of 3.85. Cautious traders can take some profit or tighten their stop while waiting to see how the counter is going to react. The candle of 12 Dec 12 looks strong and steady. It is likely that price will break that resistance before have a pull back.
On the extreme, Olam seems to stablised at its current price after so much talks in the media. Nontheless, there is a stronger support at 1.35.


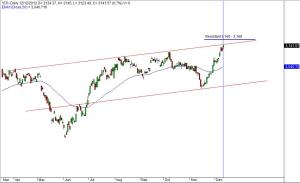
STI broke its 12-months high of 3,100 and attained a high of 3,145 today. Looking at the chart, the Index is reaching the upper channel resistance as well as projected resistant of 3,160. I would expect market to react around these resistances. Expect profit taking in this region then follow by a small pause before market searches for new direction again.
DJ was +39 and local market resumes its vibrance with confidence. Like I said, window dressing in Dec. Funds are buying and STI reaches 3,107 at 10.50 am. It is around the market resistance of 3,110 for the last 12 months. Smart traders were already in the market when it turns around from 2,950. Getting in now would mean high risk but then, there is one whole month to play around. It seems that the market is having a short-term speculative play but I don’t eliminate the possibility of it breaking the resistance of 3,110. We shall see how the candles behave for the next couple of days to see if it really break 3,110.
After some shocks, STI manages to climb back to 3000 today. The previous support at 2945 holds and upon clearing the 3000 mark, the new support will be 3000. It is still weak but as we approach the window dressing months, I would expect STI to remain above 3000, unless there are other sudden mishaps in the US / Europe / China.
I have come a long way in understanding the market and consistently profit from it, battling the greed and fear. Proper risk management and careful use of strategies help. I was once an inexperience and fearful investor so I understand what is it like to feel lost when the market turns against you. Taking this opportunity, I would like to share with you my thoughts on the market and perhaps some technical tools to help some beginners to start off. For those who lost money in the market, you may email me with your trade details so that I can better explain to you, using technical analysis, on what had gone wrong, purely for educational purposes so that you can avoid such mistakes in future.
As I have just started this blog, it may take a while for me to populate this site with information. I will try to put some interesting content in this website.
